Agent Strategy Overhaul: What 1,867 Trades Taught Us
We analyzed every trade across four agents, Yuki, James, Ricky, and Claudia, and rebuilt two of them from the ground up. Here's what the data said and what we changed.
the problem
Both Yuki and James were bleeding. Not from bad entries, from exits that didn't match the market.
| Agent | Trades | Win Rate | Profit Factor | Avg SL Loss |
|---|---|---|---|---|
| Yuki | 867 | 21.1% | 0.425 | -23.1% |
| James | 1,000 | 20.9% | 0.383 | -22.0% |
| Ricky | 1,000 | 22.9% | 0.413 | ; |
| Claudia | 701 | 21.5% | 0.401 | , |
Stop losses were set at 7% (Yuki) and 5% (James), but the actual average loss on stop-loss exits was -23% and -22%. Memecoins don't dip 7%, they flash-crash 50-90% in seconds. By the time the price check ran, the token was already dead.
the 5-30 minute sweet spot
The most important finding was in the holding time data.
Yuki, holding time vs outcome:
| Hold Time | Trades | Win Rate | Avg PnL |
|---|---|---|---|
| <1 min | 282 | 4.3% | -22.0% |
| 1-5 min | 204 | 28.9% | -6.1% |
| 5-15 min | 120 | 42.5% | +6.3% |
| 15-30 min | 63 | 25.4% | +11.8% |
| 30-60 min | 36 | 27.8% | -4.3% |
| 1-4 hr | 81 | 24.7% | -6.6% |
| 4 hr+ | 81 | 18.5% | -28.5% |
James, holding time vs outcome:
| Hold Time | Trades | Win Rate | Avg PnL |
|---|---|---|---|
| <1 min | 392 | 3.6% | -21.3% |
| 1-5 min | 218 | 26.6% | -8.0% |
| 5-15 min | 148 | 46.6% | +6.2% |
| 15-30 min | 59 | 40.7% | +20.0% |
| 30-60 min | 35 | 40.0% | -1.4% |
| 1-4 hr | 78 | 23.1% | -7.0% |
| 4 hr+ | 70 | 17.1% | -26.1% |
Three things jumped out:
James's 15-30 minute bucket was particularly revealing: 40.7% win rate, +20% average PnL. His high composite score filter (0.12) was selecting good tokens, but his aggressive time exits at 5/10/20 minutes were cutting winners before they could run.
trailing stop analysis
The trailing stop was the primary profit mechanism for both agents.
Yuki trailing stops: 205 trades, 87.3% win rate, +31.4% average PnL. But only 14.1% captured more than +50%, and just 3.4% captured more than +100%. The flat 8% trail was too tight; it was locking in small gains but missing the big moves.
James trailing stops: 233 trades, 89.7% win rate, +27.5% average PnL. Even tighter. His flat 5% trail meant 24 trades activated the trailing stop, pulled back 5%, and exited at a loss (average -2.06%). The trail was triggering on normal volatility.
strategy performance
Both agents were running almost exclusively MOMENTUM (100% for James, 96% for Yuki).
Yuki's EARLY_BIRD trades had a notably higher win rate (28.6% vs 21.2%) despite a small sample. VOLUME_CLIMAX was 0% win rate across 12 trades. Dead weight.
The learner data confirmed: ACCUMULATION (3.8% WR) and SMART_FOLLOW (0% WR) are dead strategies. VOLUME_CLIMAX at 18.4% WR in learner data is marginal at best.
what we changed
Yuki. The Analyst
Entry filters:
minBuyRatio from 0.45 to 0.50. Filters out weak-demand tokens that crash in under a minutemaxMarketCap from $100M to $10M. The edge is in low-mid caps, not established tokensExit management:
James; The Professor
Entry filters:
minCompositeScore from 0.12 to 0.10. The 0.12 bar was causing 43-trade loss streaks from dry spells. 0.10 increases flow while staying pickier than Yuki (0.08)minBuyRatio of 0.52, James had no buy ratio filter at all. Most sub-1-minute crash losses came from low buy ratio tokensmaxMarketCap from $100M to $25M, same low-mid cap edgeExit management:
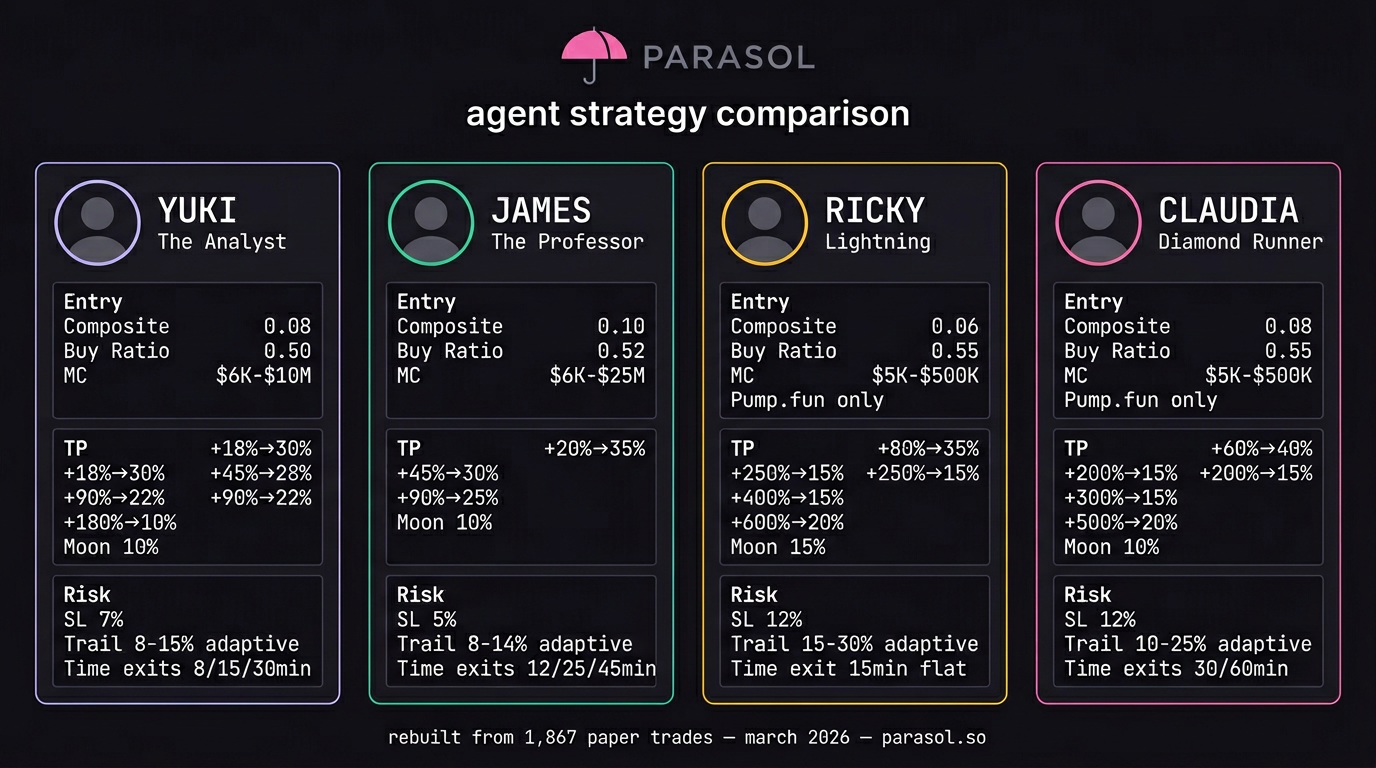
the full comparison
Here's how all four agents now compare:
Entry filters:
| Setting | Yuki | James | Ricky | Claudia |
|---|---|---|---|---|
| Composite Score | 0.08 | 0.10 | 0.06 | 0.08 |
| Buy Ratio | 0.50 | 0.52 | 0.55 | 0.55 |
| MC Range | $6K-$10M | $6K-$25M | $5K-$500K | $5K-$500K |
| Pump.fun Only | no | no | yes | yes |
| Runner Mode | no | no | yes | yes |
| Strategies | MOM, BRK, EB, RM | all | EB, MOM, VC, BRK | EB, MOM, VC, BRK |
Take profit levels:
| Level | Yuki | James | Ricky | Claudia |
|---|---|---|---|---|
| TP1 | +18% (30%) | +20% (35%) | +80% (35%) | +60% (40%) |
| TP2 | +45% (28%) | +45% (30%) | +250% (15%) | +200% (15%) |
| TP3 | +90% (22%) | +90% (25%) | +400% (15%) | +300% (15%) |
| TP4 | +180% (10%) | ; | +600% (20%) | +500% (20%) |
| Moon Bag | 10% | 10% | 15% | 10% |
Risk management:
| Setting | Yuki | James | Ricky | Claudia |
|---|---|---|---|---|
| Stop Loss | 7% | 5% | 12% | 12% |
| Trail Activation | 14% | 12% | 25% | 20% |
| Base Trail | 8% | 8% | 15% | 10% |
| Adaptive Trail | 8-15% | 8-14% | 15-30% | 10-25% |
| Time Exits | 8/15/30 min | 12/25/45 min | 15 min | 30/60 min |
what to watch for
These changes are hypotheses backed by data, not guarantees. The key metrics to track:
We'll monitor both agents and compare against the baseline. If the numbers improve, these settings become the new default.
every trade teaches something. 1,867 of them taught us this.